Rules Of Creating Infographics

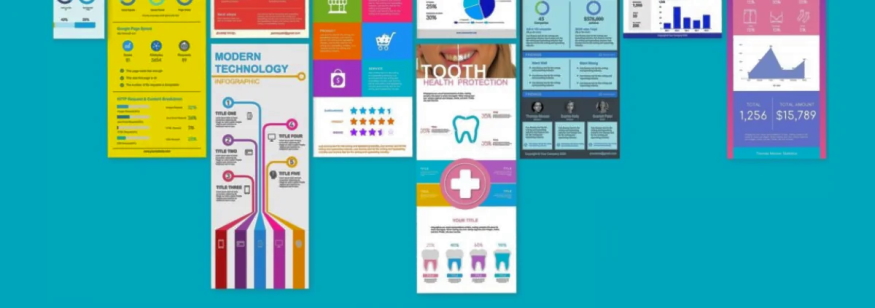
Infographics are the graphical representation of any given topic in the form of a graph. This makes it easy to understand any particular case explicitly. This includes more of a pictorial representation of information and minimal text in the bulleted forms. Now, what are the essential rules of creating infographics?
Make one big point
The entire infographic server should have one holistic message to deliver for one particular issue. Various metaphors and data are used to narrate a story. It must be kept in mind to keep it very simple rather than complicating it.

Use a simple combination of primary colors.
Road signs are the perfect example to teach you that simple primary colors have lots to depict. Example Red is a sign of danger; yellow gives you little hope to proceed, green signals you to be ready. Similarly, these primary colors must be used in the graphical representation to depict what words cannot express. Ensure your background is light, and your texting colors should be bright to give an embossing look. But again, don’t use too many from the color palette. Just 2-3 combinations would do. If possible, provide keys to the use of colors to send different data.
Don’t make the area clumsy
Provide your element in a spacious manner so that the reader may have that catchy experience of prioritizing first in reading. Make sure you include only those sentences which are of utmost importance. And the use of words and combining them into sentences should be done using minimal words. This is the most important rule for successful infographics.

Selection of standard fonts
Another essential element in designing infographics is the wise selection of fonts. As mentioned above, your words should speak less and work more. So just the titles, headings, and some catchy captions would work better. Besides these vitals, cut your rest of the speeches. Remember, the readers are not keen on reading articles or journals. Importantly, select a minimal number of fonts. One for the title should be the creative one, another for the heading, and just one another for the caption.
Start with the designing
Designing is the most vital add-on in infographics. The layout itself explains the plotting vividly. The layout shout should be designed to depict the flow of a story from one plot to another twist or turns. You can find an infographics designing guide on various platforms of search.

 There are two things that I'm passionate about: Drawing + Art. As an art teacher, author, graphic designer, and mom to 3 creative thinkers, I get to explore my passions every day! Learn more...